What does it mean to graph a function of a complex variable, w = f(z)?
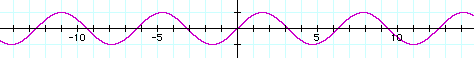
Let us first consider a real function of a real variable, y = sin(x), for example. The set of points (x,y) which satisfy this can be graphed, for some finite domain, as a 2D picture:
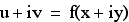
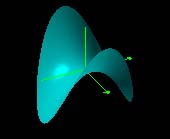
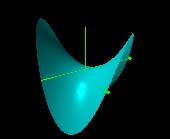
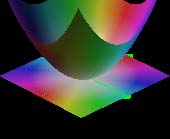
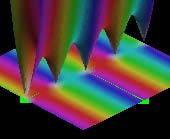
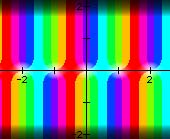
A real function of two variable, z = sin(x*y), for example, can be graphed, over some finite domain, as the height of a 3D surface, a density plot, or a set of contour lines:
 |
 |
 |
The surface on the left is a 3D model of the (x,y,z) points satisfying the equation. The density plot in the middle represents the value of the function at (x,y) as a color. The contour plot on the right shows curves in the (x,y) plane where the function is constant.
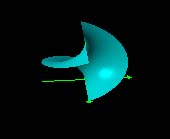
A function of a complex variable, w = f(z), can be thought in terms of its real components:
We will demonstrate a number of ways to visualize the set of points (x, y, u, v) satisfying this equation.
Not all of these techniques are distinct. Color mapping can be used in conjunction with any technique to either encode more information, or to redundantly encode information to make interpretation easier. The 3D surface representations are just a special case of the 4D perspective projection choosing particular views which are easier to understand.
 |
 |
| Re(z2) | Im(z2) |
 |
 |
| |z2| | arg(z2) |
 |
 |
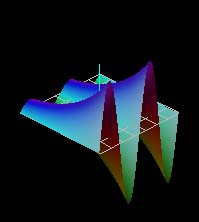
| |z2| color coded by arg(z2) | |sin πz| colored by argument |
 |
 |
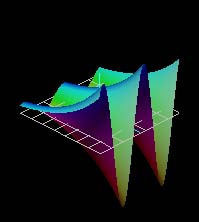
| sin πz Zeros are white. |
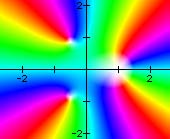
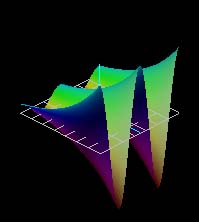
(z3 - 1)(z - 1) The color cycles twice at the double root. |
 |
 |
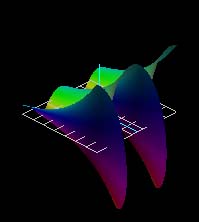
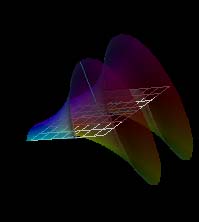
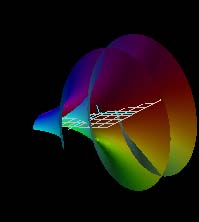
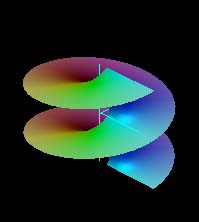
| ez | z2 |
 |
 |
 |
 |
 |
 |
 |
 |
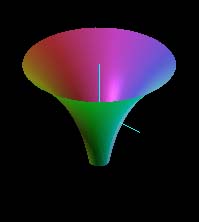 |
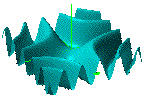
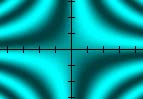
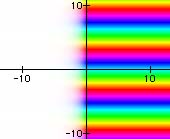
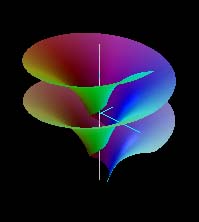
All of the images above are different views of the complex exponential function. In general, one can see the sinusoidal variation along the imaginary or y-axis and exponential variation along the real or x-axis. The white grid is the (x,y) plane at u = v = 0. In some views, it is seen edge-on as a white line segment.
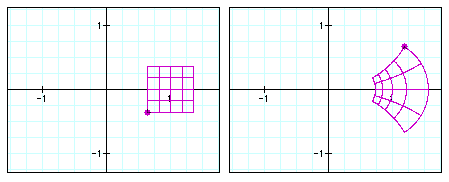
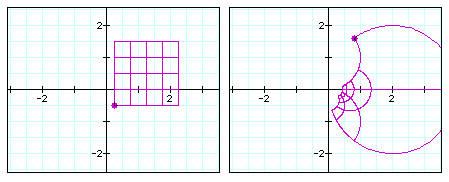
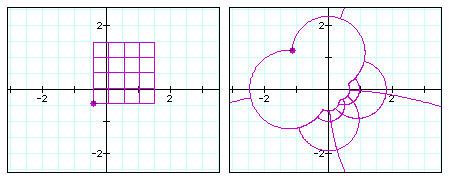
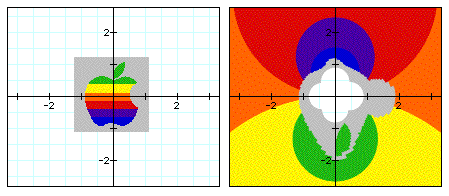

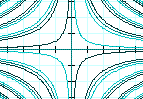
In all the images above, the lines and picture are the left are mapped under the complex inverse function to produce the image on the right.
If you have installed the free viewer, clicking on an image above will open a corresponding document.
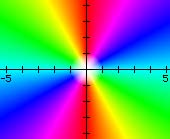
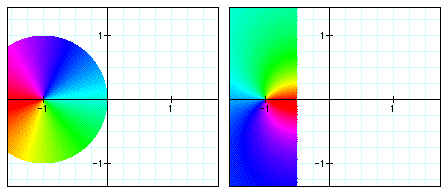
In the color maps, hue indicates phase, saturation and lightness indicate magnitude. Real values are cyan, pure imaginary values are red.
