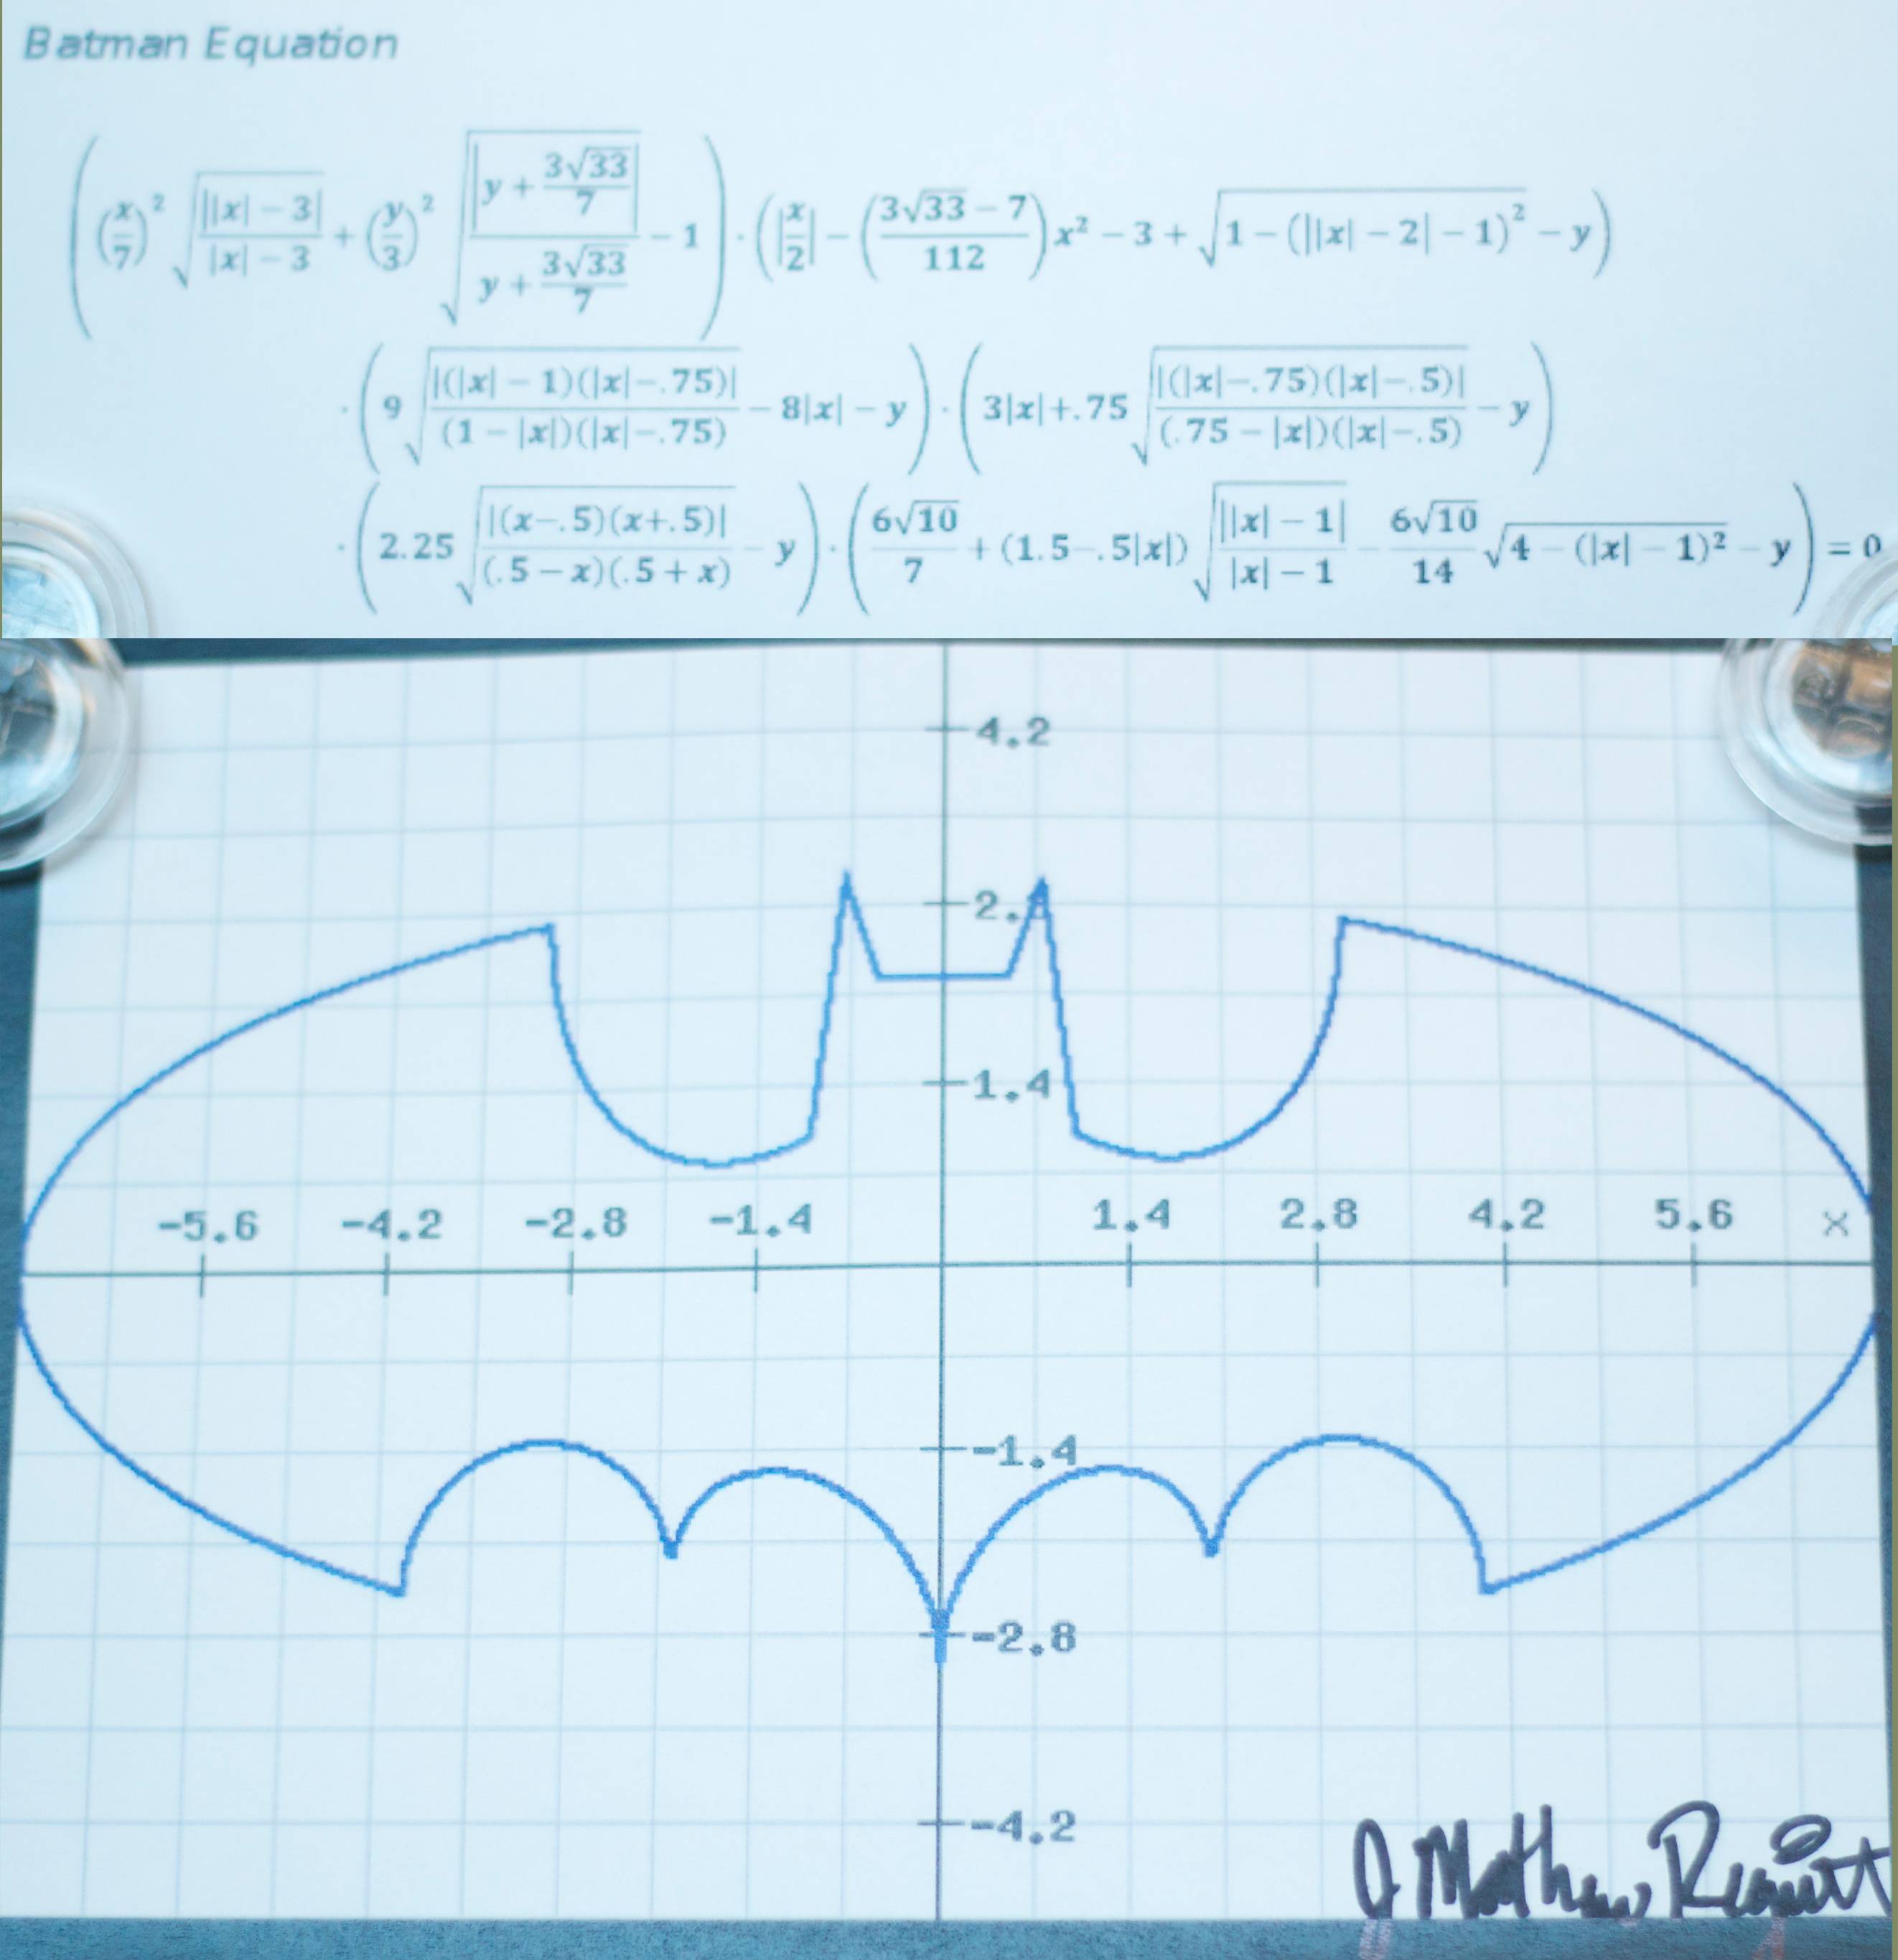
The BatMan equation seen below has been making the rounds on the internet recently. Here is a term by term deconstruction and explanation of how the equation was constructed.

Let's begin with some basic algebra and graphing: y = x is the formula for a line +45 degrees through the origin:
![]()
We can re-write y=x by subtracting x from both sides as the equation y-x=0. That doesn't change anything, though - the graph is the same.
y = -x, or equivalenty, y+x=0 is the formula for a line -45 degrees through the orign:
![]()
Now, here is the first trick. If we want a single equation to graph both of the lines (x+y)=0 and (x-y)=0, we can multiply the left hand side of the equations together. Since any number times zero is zero, the solutions to our new equation (x+y)*(x-y)=0 occur when either x+y=0 or x-y=0 which is exactly what we want to graph both lines:
![]()
The Batman equation is the product of six terms on the left-hand side set equal to 0. To understand it, we can look at each of the six terms separately, since the graph is just the composition of the six graphs where any one term is equal to zero. Each term is still complicated when taken individually, however, so before we examine each one, there is one more trick to explain in detail.
Consider the absolute value of x, which is defined as +x when x is positive, and -x when x is negative, and of course, zero when x is zero:
![]()
Then divide that by x, giving the function |x|/x, which is +1 when x>0, -1 when x<0, and undefined at zero:
![]()
If we replace x with x-1 everywhere, that shifts the graph over to the right by one:
![]()
Now we have an equation for a graph that is +1 when x>1 and -1 when x<1. If we replace x by the absolute value of x in this equation, that takes the right-hand side of the graph and flips it as if through a mirror along the y-axis, giving us an equation for a graph that is -1 when -1<x<1, and +1 when x is outide the range from -1 to +1.
![]()
The last step in our trickery is to take the square root of all that. The square root of 1 is still 1, but the square root of -1 is the complex number i. Since we're now graphing real numbers on the real-valued x y plane, the complex values do not appear:

But that is just a complicated obscure way of saying a very simple thing:
![]()
Now we're ready to look at the first term in the Batman equation. Ignoring the square root trick, it is just the equation of an ellipse:
![[x/7]^2+[y/3]^2=1](eq1a/formula1.png)
The first square root term chops the middle out of the ellipse using the trick we learned above:
![[x/7]^2+[y/3]^2=1,abs(x)>3](eq1b/formula1.png)
The second square root term chops a little bit more off the bottom:
![[x/7]^2+[y/3]^2=1,abs(x)>3,y>[-3]*sqrt(33)/7](Eq1/formula1.png)
The next five terms can be understood as functions of x, three of them are linear or piecewise linear:
![y=abs(x/2)-([(3*sqrt(33)-7)/112]*x^2)-3+sqrt(1-[abs(abs(x)-2)-1]^2)](Eq2/formula1.png)
![]()
![]()
![]()
![y=6*sqrt(10)/7+[-(0.5*abs(x))+1.5]-(3*sqrt(10)/7*sqrt(4-[abs(x)-1]^2)),abs(x)>1](Eq6/formula1.png)
Putting all those pieces together, and color-coded to match equation to graph:
Here the terms are written more clearly, with the domain restrictions spelled out explicitly
![]()
![]()
![]()
![]()
![]()
![]()
Lastly, here is the original Batman equation. The function must be evaluated as a complex numbers or the square root terms will be undefined. The artifacts in the graph are due to accumulating numeric inaccuracies in evaluating the complex numbers which occur in intermediate steps when evaluating the original equation.
![[[x/7]^2*sqrt(abs(abs(x)-3)/(abs(x)-3))+[y/3]^2*sqrt(abs(y+3*sqrt(33)/7)/(y+3*sqrt(33)/7))-1]*[abs(x/2)-([(3*sqrt(33)-7)/112]*x^2)-3+sqrt(1-[abs(abs(x)-2)-1]^2)-y]*[9*sqrt(abs([abs(x)-1]*[abs(x)-0.75])/([1-abs(x)]*[abs(x)-0.75]))-(8*abs(x))-y]*[3*abs(x)+0.75*sqrt(abs([abs(x)-0.75]*[abs(x)-0.5])/([0.75-abs(x)]*[abs(x)-0.5]))-y]*[2.25*sqrt(abs([x-0.5]*[x+0.5])/([0.5-x]*[0.5+x]))-y]*[6*sqrt(10)/7+[1.5-(0.5*abs(x))]*sqrt(abs(abs(x)-1)/(abs(x)-1))-(6*sqrt(10)/14*sqrt(4-[[abs(x)-1]^2]))-y]=0*i](BatmanEquation/formula1.png)
This file was created by Graphing Calculator 4.0.
Visit Pacific Tech to download the helper application to view and edit these equations live.
You can order Graphing Calculator 4.0 for Macintosh or Windows from Pacific Tech here.


